class: center, middle, inverse, title-slide # A wild ride through New York City ## Building Data Science Workflows with Kotlin<br><br><img src='images/kotlin_conf_logo.png' width='400'> ### <a href='https://twitter.com/holgerbrandl'><span class="citation">@holgerbrandl</span></a> --- # The data-scien[ce|tists] life cycle .center[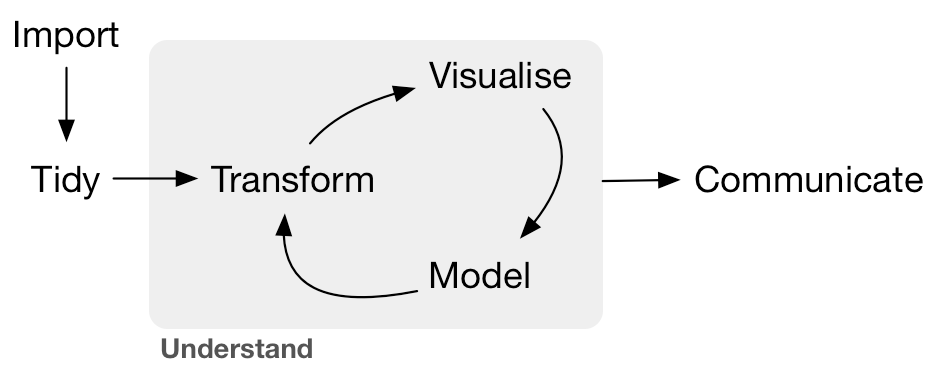] * Python: `pandas` + `scikit-learn` + `matplotlib`/`seaborn` + `jupyter` * R: `readr` + `tidyr` + `dplyr` + `ggplot2` + `caret`/`broom` + `knitr` * JVM, and Kotlin in particular? ??? Def Data Scientist from https://www.kdnuggets.com/2017/05/42-essential-quotes-data-science-thought-leaders.html > half hacker, half analyst, they use data to build products and find insights or >> Data Scientist (n.): Person who is better at statistics than any software engineer and better at software engineering than any statistician. --- background-image: url(images/java_reading.jpg) background-position: center background-repeat: no-repeat background-size: 90% # Can we do data science with Kotlin? Are the language and tooling suited and ready for data science? ### Can we express typical data problems and workflows? ### Is there an interactive shell? ### How to manipulation typed and untyped data? ### How to do data visualization? ### How to build reports & Notebook Support? -- ## So can we? We wont' know without trying! ??? Should we? Yes, because * R & Python fail to be scalable & robust solutions for data science * Java is known for great dependency tooling & scalability * Java as a language is less well suited for data-science (cluttered, legacy bits) --- background-image: url(images/nyc.jpg) background-position: center background-repeat: no-repeat background-size: 100% class: middle, inverse, center </p> https://www.kaggle.com/c/nyc-taxi-trip-duration/ # Predict NYC Taxi Trip Durations with Kotlin ??? Image source (public domain) https://www.goodfreephotos.com/united-states/new-york/new-york-city/aerial-photo-of-new-york-city.jpg.php --- class: middle, inverse # Kotlin Stack for Data Science ## Interactive Shell ### Manipulation of typed and untyped data ### Data Visualization ### Report Rendering & Notebook Support --- # IDE console and terminal REPL need more work .left-column50[ * [KT-11409](https://youtrack.jetbrains.com/issue/KT-11409) Add action "Send Selection To Kotlin Console" * [KT-7100](https://youtrack.jetbrains.com/issue/KT-7100) REPL: Allow adding a library to the classpath * [KT-21224](https://youtrack.jetbrains.com/issue/KT-21224 ) Incorrect alignment of commands and outputs in REPL * [KT-13319](https://youtrack.jetbrains.net/issue/KT-13319) - REPL: support ":paste" for pasting multi-line expressions > ### Overall usability not yet _en par_ with R or python ] .right-column50[  ] ??? project structure too rigid (varying dependencies between scripts) --- class: inverse # `khud/sparklin` .center[] > `sparklin` is a proof-of-concept software that includes a experimental new Kotlin REPL (aka `KShell`) which supports extensions and custom commands via a plugin system. --- # How to start a `kshell`? No proper launcher in repo yet, but meanwhile we can use [`kshell_kts.sh `](https://github.com/holgerbrandl/kscript/tree/master/misc/kshell_launcher) `krangl_example.kts`: ```kotlin @file:DependsOn("com.offbytwo:docopt:0.6.0.20150202") @file:DependsOn("de.mpicbg.scicomp:krangl:0.10.2") import krangl.sleepData // ignored when spawning shell sleepData.select("total_sleep") // ignored when spawning shell ``` Spawn your data-science shell with: ```bash kshell_kts.sh krangl_example.kts ``` ```bash Preparing interactive session by resolving script dependencies... [1] import krangl.* [2] irisData.schema() DataFrame with 150 observations Sepal.Length [Dbl] 5.1, 4.9, 4.7, 4.6, 5, 5.4, 4.6, 5, 4.8, 4.8, 4.3, 5.8, 5.7, 5.4,... Sepal.Width [Dbl] 3.5, 3, 3.2, 3.1, 3.6, 3.9, 3.4, 3.4, 3.4, 3, 3, 4, 4.4, 3.9, 3.5... Petal.Length [Dbl] 1.4, 1.4, 1.3, 1.5, 1.4, 1.7, 1.4, 1.5, 1.6, 1.4, 1.1, 1.2, 1.5, ... Petal.Width [Dbl] 0.2, 0.2, 0.2, 0.2, 0.2, 0.4, 0.3, 0.2, 0.2, 0.1, 0.1, 0.2, 0.4, ... Species [Str] setosa, setosa, setosa, setosa, setosa, setosa, setosa, setosa, s... [6] ``` --- class: middle, inverse # Kotlin Stack for Data Science ### Interactive Shell ## Manipulation of typed and untyped data ### Data Visualization ### Report Rendering & Notebook Support --- # What about Kotlin stdlib? * Great collection API * * Useful IO utilities like `File.readLines()` * `map`, `fold`, `filter`, `reduce` are cool and fun * Great string manipulation helpers * Grouping API ```kotlin data class User(val firstName: String?, val lastName: String, val age: Int, val hasSudo: Boolean?) val users = listOf(User(...), ...) val groupingBy : Grouping<User, Int> = users.groupingBy { it.age } groupingBy.eachCount() users.groupingBy { listOf(it.age, it.hasSudo) }.map{ ... }.fold{ ... } ``` ### No enough to implement data science life cycle! ??? More advanced slicing possible with https://github.com/thomasnield/kotlin-statistics so apart from the amazing language spec, what is in the stdlib for data science winter is coming --> summer is coming .. so another year no beachbody for details see https://kotlinlang.org/api/latest/jvm/stdlib/kotlin.collections/-grouping/ --- # Check what else is out there * [tablesaw](https://github.com/jtablesaw/tablesaw) which is (according to its authors) the _The simplest way to slice data in Java_ * [Scala DataTable](https://github.com/martincooper/scala-datatable): a lightweight, in-memory table structure written in Scala * [kotliquery](https://github.com/seratch/kotliquery) is a handy database access library * [koma](https://kyonifer.github.io/koma/) is a scientific computing library written in Kotlin * [joinery](https://github.com/cardillo/joinery) implements data frames for Java * [paleo](https://github.com/netzwerg/paleo) which provides immutable Java 8 data frames with typed columns * [morpheus-core](https://github.com/zavtech/morpheus-core) which is a data science framework implementing an R-like data-frame for the JVM * [vectorz](https://github.com/mikera/vectorz) is a fast and flexible numerical library for Java featuring N-dimensional arrays * [termsql](https://github.com/tobimensch/termsql) converts text from a file or from stdin into SQL table using sqlite and query it instantly > ### Great stuff, but not feature-complete enough, maintained or _kotlinesque_ as needed for fluency and fun with data --- class: inverse # `krangl` .center[] > `krangl` is a {K}otlin library for data w{rangl}ing. By implementing a grammar of data manipulation using a modern functional-style API, it allows to filter, transform, aggregate and reshape tabular data. ??? Can we build a what pandas is for `python`, and `readr`+`tidyr`+`dplyr` are for R? --- # Data model of `krangl` What is a DataFrame? > A "tabular" data structure representing cases/records (rows), each of which consists of a number of observations or measurements (columns) ```kotlin interface DataFrame { val cols: List<DataCol> } abstract class DataCol(val name: String) { abstract fun values(): Array<*> } ``` * Implemented as column model to allow for vectorization where possible * Column implementations for `String?`, `Int?`, `Double?`, `Boolean?` and `Any?` * Internal length and type consistency checks (e.g. prevent duplicated column names) ??? Approached it from a naive forward orientied perspective colleagues: "Holger, work with vectors or you'll end up in hell" Nullable types core concept of Kotlin !! Def from https://github.com/mobileink/data.frame/wiki/What-is-a-Data-Frame%3F --- # Get your data into krangl Define tables inline ```kotlin val users = dataFrameOf( "firstName", "lastName", "age", "hasSudo")( "max", "smith" , 53, false, "eva", "miller", 23, true, null , "meyer" , 23, null) ``` Read & write from tsv, csv, json, jdbc, etc. ``` kotlin val tornados = DataFrame.readCSV(pathAsStringFileOrUrl) // do stuff tornados.writeCSV(File("tornados.txt.gz")) ``` * Guess column types & default parameters * Built-in missing value support ??? low hanging fruits first --> the easy part try to match kotlin wording `dataFrameOf` --- background-image: url(images/nyc.jpg) background-position: center background-repeat: no-repeat background-size: 100% class: middle, inverse, center </p> https://www.kaggle.com/c/nyc-taxi-trip-duration/ # Predict NYC Taxi Trip Durations with Kotlin --- # What to expect from an API for table manipulation? > 90% of Data Science is *just* table integration! What are the essential verbs to manipulate tables? Learn from the best, learn from the **[`R::tidyverse`](https://www.tidyverse.org/)**! .pull-left[ `tibble` - Data structures `tidyr` - Data preparation `purrr` - List Columns & nested tables `dplyr` - Data manipulation with _5+1_ verbs * Select columns with `select()` * Inspect subsets of data with `filter()` * Add new columns with `mutate()` * Reorder rows with `arrange()` * Summarise records with `summarise()` * Perform grouped operations after `group_by()` ] .pull-right[  ] ??? * Supported and condensed into amazing [cheatsheets](https://www.rstudio.com/resources/cheatsheets/) by [rstudio](https://www.rstudio.com/) Data model, `readCSV`, `addColumn`, `select`... What else do we need? How to design a fluent DSL/API? --- background-image: url(images/data_trafo_1_cs_checked.png) background-position: center background-repeat: no-repeat background-size: 78% ??? some function intentionally left out, feasabilty prototype first --- background-image: url(images/data_trafo_2_cs_checked.png) background-position: center background-repeat: no-repeat background-size: 78% --- background-image: url(images/nested_data_cs_checked.png) background-position: center background-repeat: no-repeat background-size: 78% ??? nested tables exteremly powerful concept. --- background-image: url(images/tidyr_cs_checked.png) background-position: center background-repeat: no-repeat background-size: 78% --- # Example: Summarize Flights by Date ```kotlin flightsData .groupBy("year", "month", "day") .select({ range("year", "day") }, { listOf("arr_delay", "dep_delay") }) .summarize( "mean_arr_delay" `=` { it["arr_delay"].mean(removeNA = true) }, "mean_dep_delay" to { it["dep_delay"].mean(removeNA = true) } ) .filter { (it["mean_arr_delay"] gt 30) OR (it["mean_dep_delay"] gt 30) } .sortedBy("mean_arr_delay") ``` ``` year month day mean_arr_delay mean_dep_delay 2013 10 11 18.9229 31.2318 2013 5 24 24.2574 30.3407 2013 6 2 26.075 34.0133 2013 6 26 27.3174 30.61175 2013 6 10 28.0222 30.61945 2013 7 8 29.6488 37.2966 2013 8 22 29.9767 33.6004 2013 2 27 31.252 37.7632 ``` ??? either `=` or to will go away most likely --- # To type or not to type? * _Static types_ are cool, but most data has no type * It's more robust/fun to use types and they allow for better design * Many data attributes are very fluent ```kotlin data class Employee(val id:Int, val name:String) val staffStats = listOf(Employee(1, "John"), Employee(2, "Anna")) .predictNumSickDays() // new type! .addPerformanceMetrics() // new type! .addSalaries() // new type! .correlationAnalysis() // odd generic signature :-| ``` * R/python lack static typing, which make such workflows more fluent/fun to write ```r staff %>% mutate(sick_days=predictSickDays(name)) %>% # table with another column left_join(userPerf) %>% # and some more columns left_join(salaries) %>% # and even more columns select_if(is.numeric) %>% correlate(type="spearman") # correlate numeric attributes ``` ??? defining types is a tedious process correlation via: https://github.com/drsimonj/corrr --- # Wanted: Mix typed and untyped data `val dataFrame : DataFrame =` | `employee:Employee` | `sales:List<Sale>` | `age:Int` | `address:String` | `salary:Double` | |:-----|:-------------|:----|:-----|:--| | `Employee(23, "Max")` | `listOf(Sale(...), Sale())` | 23 | "Frankfurt" | 50.3E3 | | ... | ... | ... | ... | ... | ```kotlin // aggregations like dataFrame.groupBy("age").count() dataFrame.summarize("mean_salary"){ mean(it["salaray"])} // integration like val df: DataFrame = dataFrame.leftJoin(otherDF) // transformations like dataFrame.addColumn("intial"){ it["employee"].map<Employee>{ it.name.first() }} ``` ??? 1st part: comparably straightforward, just look how the others do it 2nd: dive into reflection API assess if it would by any fun to work with such an API! * `pandas`/`tidyverse` like API to create, manipulate, reshape, combine and summarize data frames * methods to go back and forth between untyped and typed data --- # Ingest `Any`thing into tables Convert any `Iterable<T>` into a data-frame via extension function ```kotlin data class Person(val name:String, val age:Int) val persons :List<Person> = listOf(Person("Max", 23), Person("Anna", 43)) val personsDF: DataFrame = persons.asDataFrame() personsDF.print() ``` ```text age name 23 Max 43 Anna ``` Or deparse `Iterable<T>`s into data frames with `Iterable<T>.deparseRecords` ```kotlin val deparsedDF : DataFrame = persons.deparseRecords { mapOf( "User Name" to it.name, "User Age" to it.age ) } ``` --- # Example: How to fit a linear regression model per group? Using http://commons.apache.org/proper/commons-math/ or https://github.com/chen0040/java-glm ```kotlin val irisModel = irisData .groupBy("Species") .summarize("lm") { val x = it["Sepal.Length"].asDoubles().filterNotNull().toDoubleArray() val y = it["Sepal.Width"].asDoubles().filterNotNull().toDoubleArray() val xTransposed = MatrixUtils.createRealMatrix(arrayOf(x)).transpose().data SimpleRegression().apply { addObservations(xTransposed, y) } } .unfold<SimpleRegression>("lm", properties = listOf("intercept", "slope")) ``` ``` Species lm slope intercept setosa org.apache.commons.math3.stat.regression.SimpleRegression@66133adc 0.798 -0.5694 versicolor org.apache.commons.math3.stat.regression.SimpleRegression@7bfcd12c 0.319 0.8721 virginica org.apache.commons.math3.stat.regression.SimpleRegression@42f30e0a 0.2318 1.446 ``` --- background-image: url(images/nyc.jpg) background-position: center background-repeat: no-repeat background-size: 100% class: middle, inverse, center </p> https://www.kaggle.com/c/nyc-taxi-trip-duration/ # Predict NYC Taxi Trip Durations with Kotlin --- class: middle, inverse # Kotlin Stack for Data Science ### Interactive Shell ### Manipulation of typed and untyped data ## Data Visualization ### Report Rendering & Notebook Support --- # Some Existing Options * [Vegas](https://github.com/vegas-viz/Vegas) Vega-lite wrapper, aims to be the missing MatPlotLib for Scala + Spark * [data2viz](https://github.com/data2viz/data2viz) is a multi platform data visualization library with comprehensive DSL * [XChart](https://github.com/timmolter/XChart) is a light-weight Java library for plotting data * [Kubed](https://github.com/hudsonb/kubed/) is a Kotlin library for manipulating the JavaFX scenegraph based on data. * [Jzy3d](http://www.jzy3d.org/) is an open source java library that allows to easily draw 3d #surfaces, scatter plots, bar charts * [plotly-scala](https://github.com/alexarchambault/plotly-scala) which provides scala bindings for plotly.js and works within jupyter More options: https://github.com/thomasnield/kotlin-data-science-resources Do they allow for convenient fluent data-vis? -- ### 1. JVM graphics device project that works from Kotlin REPL, in Intellij, and in jupyter notebooks ### 2. Still no coherent `ggplot2` like framework with grammar for graphics --- background-image: url(images/ggplot_examples.png) background-position: center background-repeat: no-repeat background-size: 100% class: middle, center The grammar of graphics (Leland Wilkinson, 2005) # `plot` := ## `aesthetics` + `layers` + <br>`coordinates system` + `transformations` + ` facets` ??? `one or more layers` + `map variables from data space to visual space` + `coordinates system` + `statistical transformations` + `optional facets` --- class: inverse # `kravis` .center[] > `kravis` implements a grammar/DSL to create a wide range of plots using a standardized set of verbs. Internally, it is _just_ a more typesafe wrapper around `ggplot2`. ??? Can we build a what pandas is for `python`, and `readr`+`tidyr`+`dplyr` are for R? --- 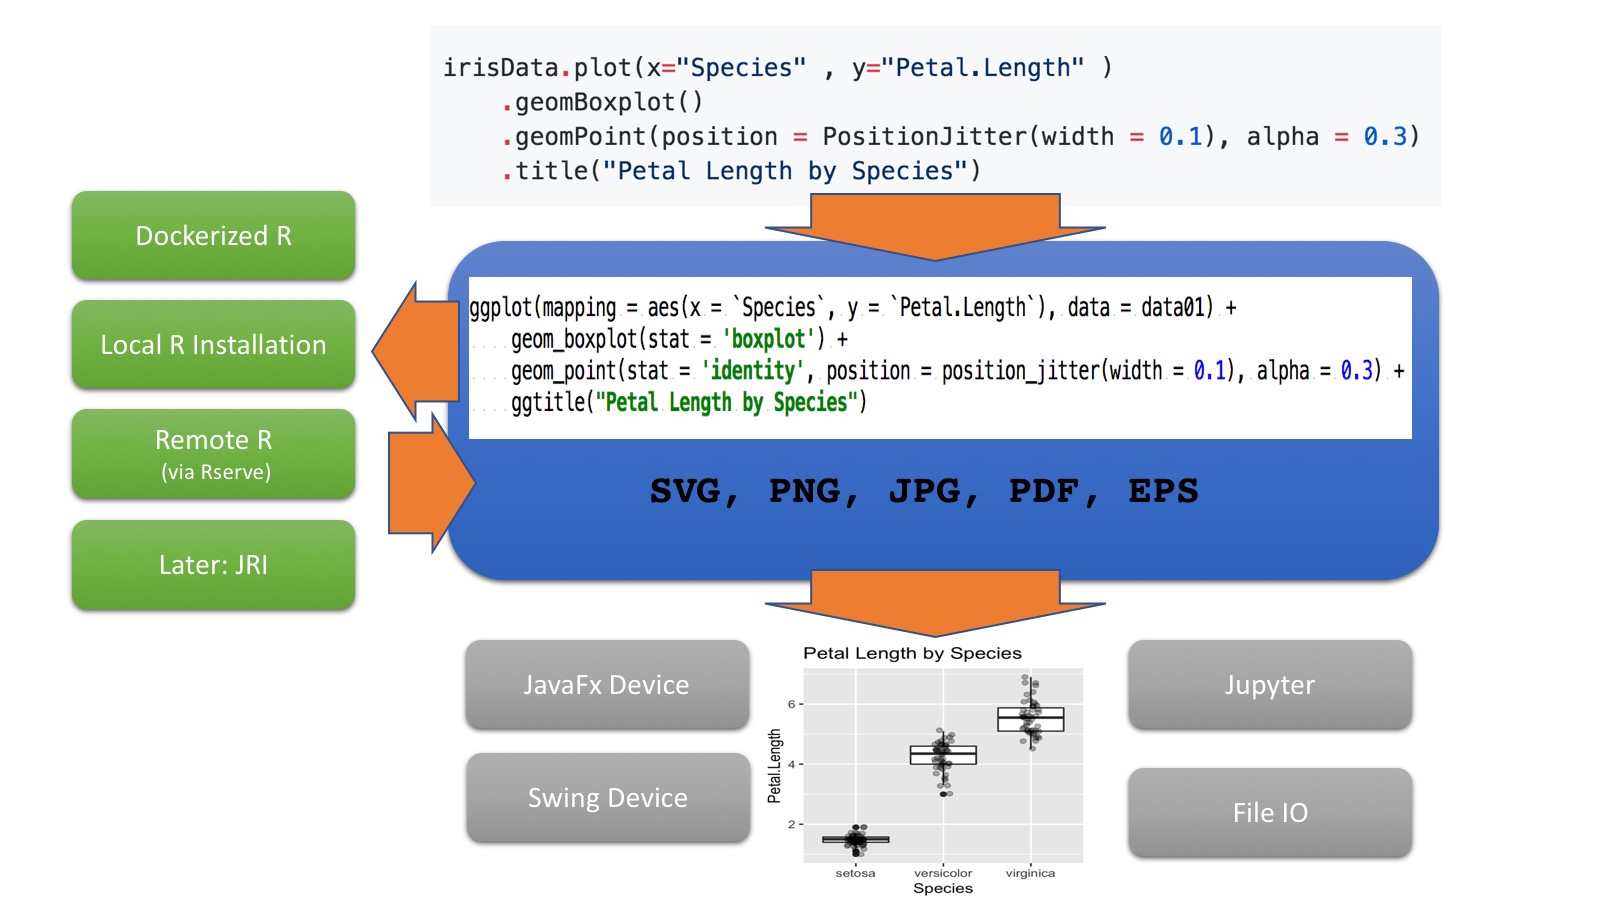 ??? `kravis` is more typesafe wrapper around `ggplot2`, which is used for rendering. It can interface with R via various rendering backends ranging including your local R, dockerize R or even a remote webservice. It provides different frontend to inspect the plots. --- # Example: Tabular API .left-column50[ ```kotlin import krangl.* import kravis.* sleepData // calculate dream time proportion .addColumn("rem_proportion") { it["sleep_rem"] / it["sleep_total"] } // Analyze correlation .plot( x = "sleep_total", y = "rem_proportion", color = "vore", size = "brainwt" ) .geomPoint(alpha = 0.7) .guides(size = LegendType.none) .title("dream vs total sleep time") ``` ] .right-column50[  ] --- # Example: Typed API Use any `Iterable<T>` to build a plot. :-) .left-column50[ ```kotlin val sleepPatterns : List<SleepPattern> = ... // deparse records using property references sleepPatterns .plot( x = SleepPattern::sleep_rem, y = SleepPattern::sleep_total, color = SleepPattern::vore, size = SleepPattern::brainwt ) .geomPoint() .title("Correlation of total sleep " + "and and rem sleep by food preference") ``` ] .right-column50[  ] --- background-image: url(images/pca_background.jpg) background-position: center background-repeat: no-repeat background-size: 100% # Perform a PCA Analaysis Using `krangl` + `kravis` + https://github.com/haifengl/smile .left-column60[ ```kotlin val irisArray = irisData.remove("Species") .toDoubleMatrix().transpose() val pca = smile.projection.PCA(irisArray) // variance proportions pca.varianceProportion.toList().withIndex() .plot(x={ it.index}, y = {it.value}) .geomCol() .yLabel("% Variance Explained") val rotData = pca.project(irisArray) // PC1 vs PC2 scatter rotData.zip(irisData["Species"].asStrings()) .plot(x={ it.first[0]}, y={it.first[1]}, color = {it.second} ) .geomPoint() ``` ] .right-column40[ ] ??? ``` fun Array<out DoubleArray>.transpose(): Array<out DoubleArray>? = JMatrix(this).transpose().array() ``` --- background-image: url(images/nyc.jpg) background-position: center background-repeat: no-repeat background-size: 100% class: middle, inverse, center </p> https://www.kaggle.com/c/nyc-taxi-trip-duration/ # Predict NYC Taxi Trip Durations with Kotlin --- class: middle, inverse # Kotlin Stack for Data Science ### Interactive Shell ### Manipulation of typed and untyped data ### Data Visualization ## Report Rendering & Notebook Support --- ##  .left-column60[ > Open-source web application that allows you to create and share documents that contain live code, equations, visualizations and narrative text. Pros * Fast prototyping * Literate Programming * Great Narrative * Shareable insights without build process Cons * Collaboration is tricky * Versioning and code reviews are hard * Webapp not a real IDE substitute -> JupyterLab ] .right-column40[  ] ??? Very popular framework that is "Super-Charging Data Science" https://www.quora.com/What-are-the-pros-and-cons-of-using-Python-Jupyter-versus-a-normal-Python-development-environment https://unidata.github.io/online-python-training/introduction.html --- # Kotlin Notebooks? > A kernel provides programming language support in Jupyter. IPython is the default kernel. Additional kernels include R, Julia, and many more. Two competing kernels for Kotlin 1. https://github.com/ligee/kotlin-jupyter * More established * Backed by JB * Friendly and responsive developers * Slow development process 2. https://github.com/twosigma/beakerx > a collection of JVM kernels and interactive widgets for plotting, tables, auto-translation, and other extensions to Jupyter Notebook. * Very active, fast progress * Friendly and very responsive developers * Not __just__ a kernel * Display handler registry in kernel `krangl.beakerx.TableDisplayer.register()` ??? beakerx: adapaters for tablesaw https://github.com/jtablesaw/tablesaw/tree/master/beakerx and morpheus --- 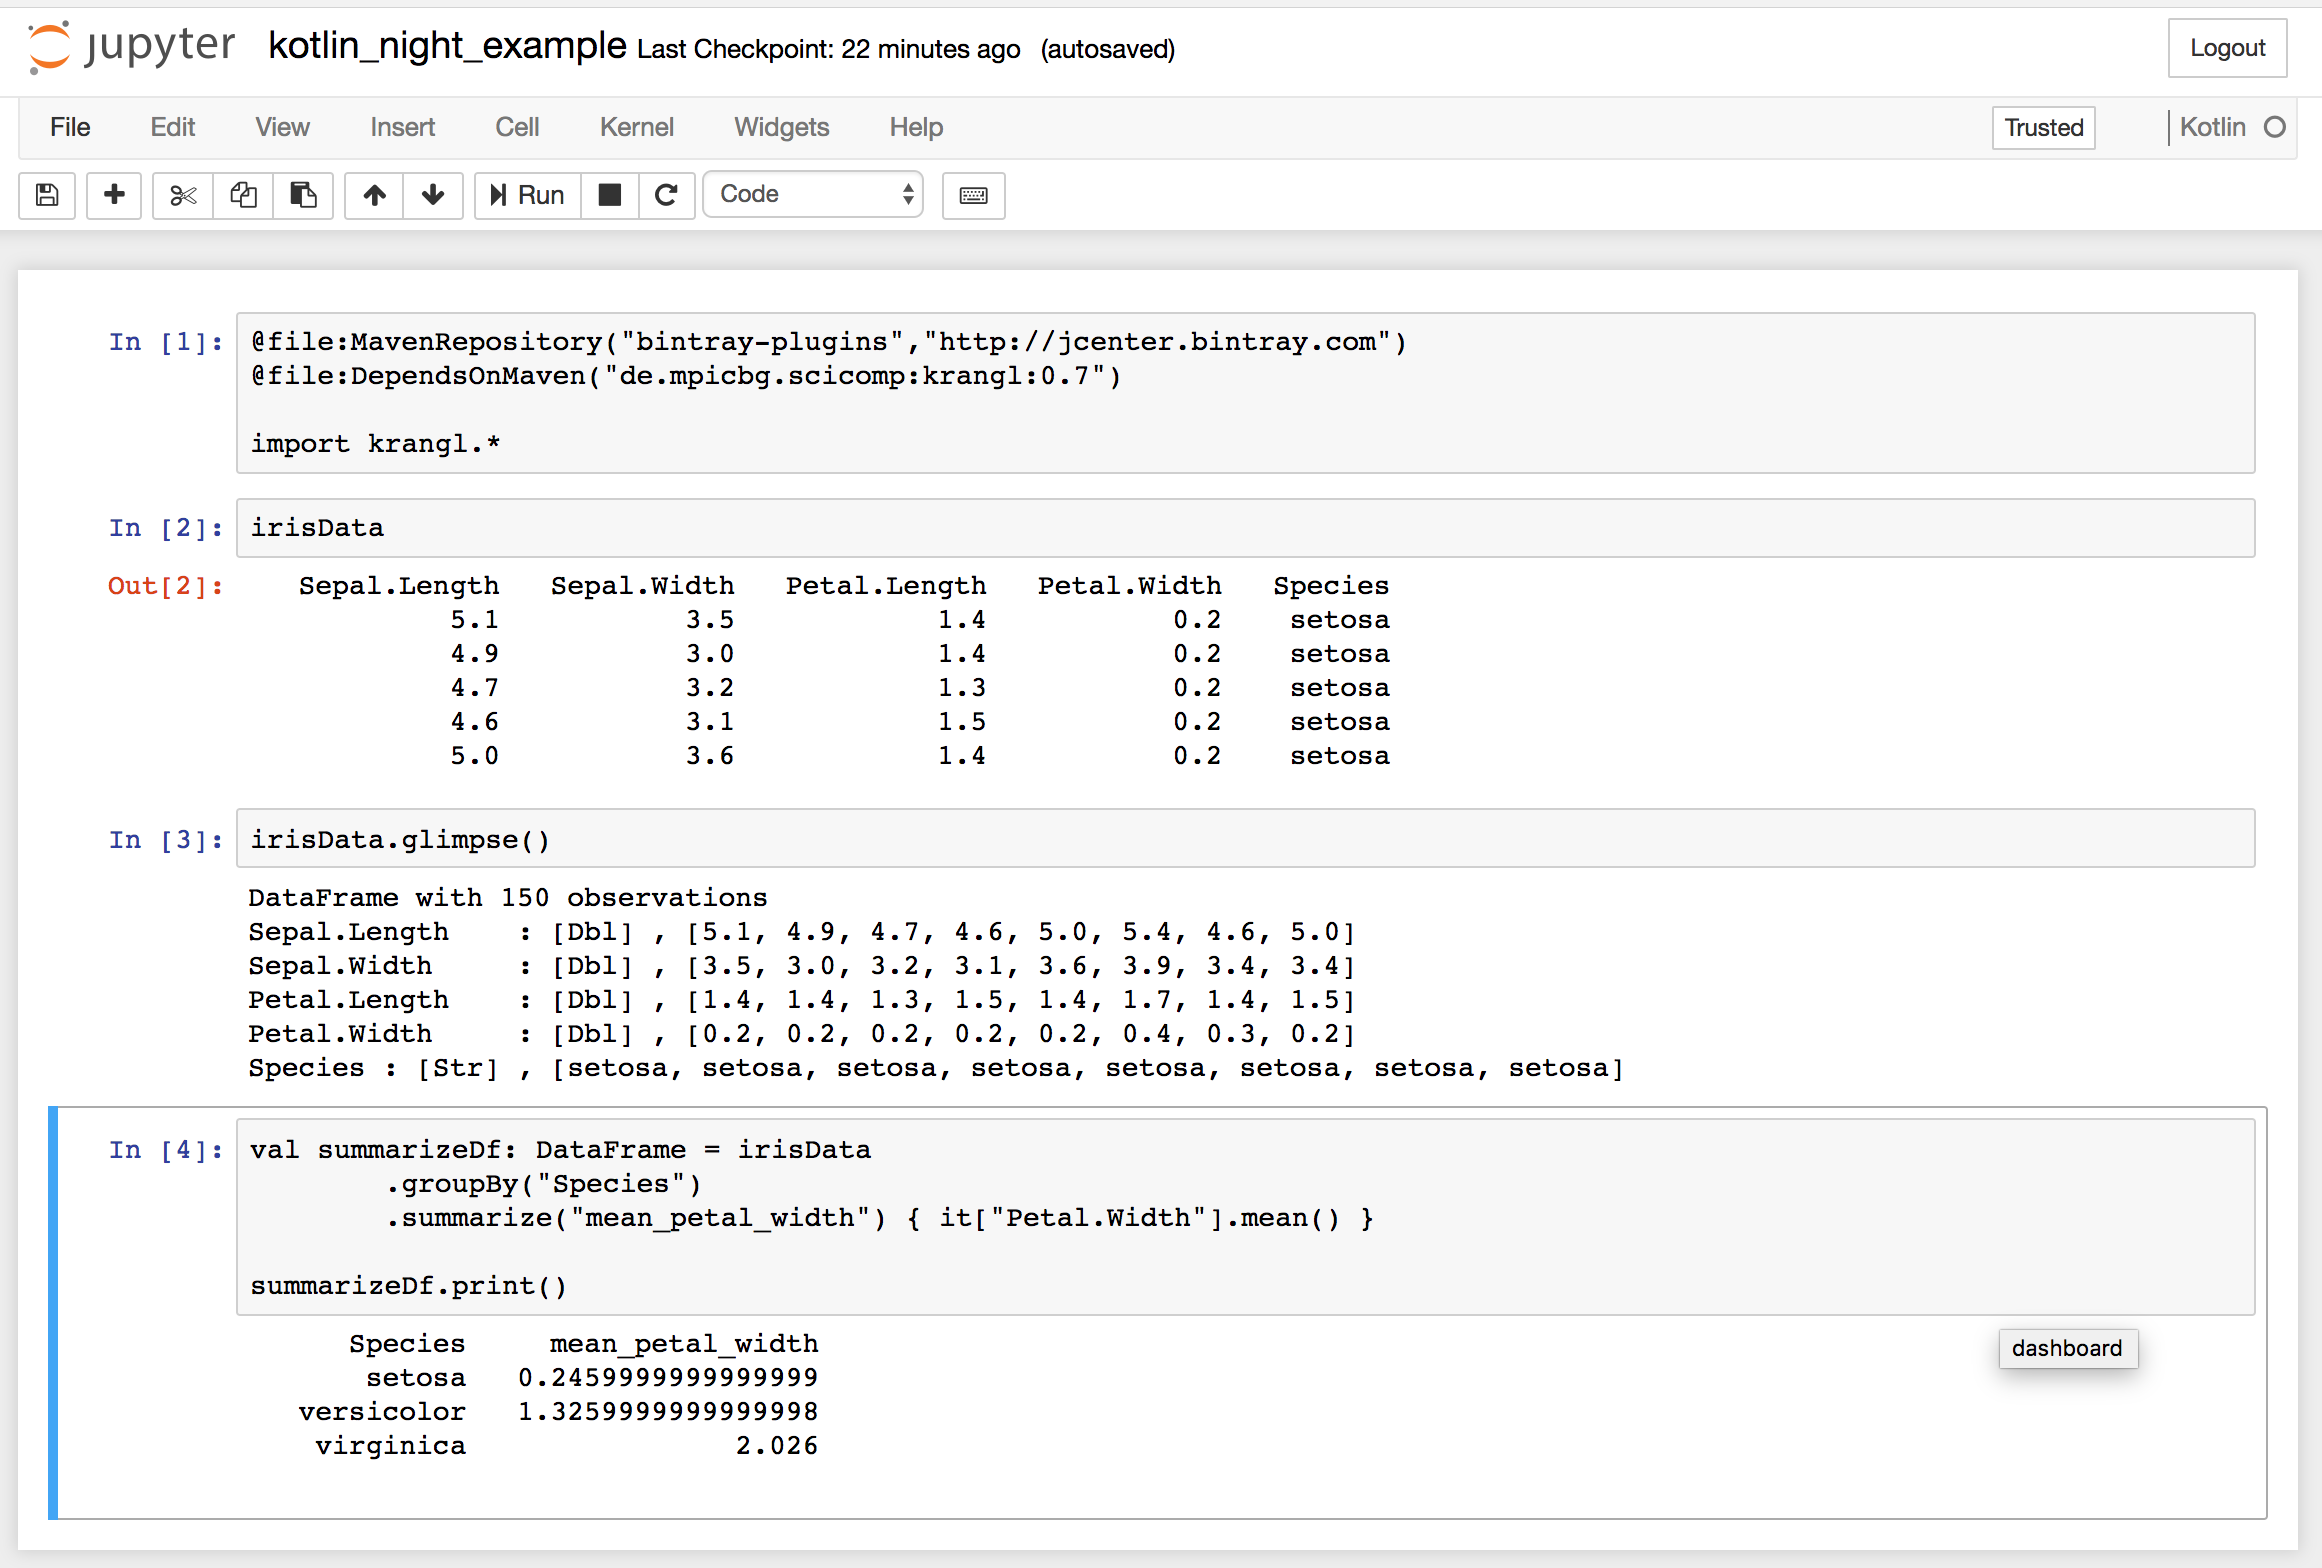 ??? Definitely cool, but lacks effieciency because of missing tooling (error checking, compeltion, refactoring) --- background-image: url(images/spin_workflow.jpg) background-position: bottom background-size: 95% # Literate Programming > Build reports including source code, results, and <br>visualization from __code__ * `python`: `notedown` + `nbconvert` * `R`: `knitr::knitr` -> `knit` -> `pandoc` -- # `kts` -> **????** --> html ??? R -> (**Speakers choice!**) * IDE markdown support very good * Kotln code chunk support not usable ## Can we do this with Kotlin? --- # Yes we can, `kts`->`markdown`->`jupyter`->`html` ```bash inputScript=krangl_example_report.kts reportName=$(basename $inputScript .kts) # https://www.r-project.org/ Rscript - ${inputScript} <<"EOF" knitr::spin(commandArgs(T)[1], doc = "^//'[ ]?", knit=F) EOF # https://github.com/holgerbrandl/kscript kscript -t 'lines.map { it.replace("{r }", "")}.print()' ${reportName}.Rmd > ${reportName}.md # https://github.com/aaren/notedown notedown ${reportName}.md > ${reportName}.ipynb # http://jupyter.org/install jupyter nbconvert --ExecutePreprocessor.kernel_name=kotlin \ --execute --to html ${reportName}.ipynb --output ${reportName} ``` Proof-of-Concept, until kernel has evolved ( [type handlers](https://github.com/ligee/kotlin-jupyter/issues/12) + multiple cell outputs) ??? the geeky corner All but the last step could be reworked into a standalone tool. Alternative approaches? --- background-image: url(images/nyc.jpg) background-position: center background-repeat: no-repeat background-size: 100% class: middle, inverse, center </p> https://www.kaggle.com/c/nyc-taxi-trip-duration/ # Predict NYC Taxi Trip Durations with Kotlin --- # Next steps: Evolve Libraries ### > Promising API experiment & Great learning experience ### `krangl` * Performance (compressed columns, backend implementation) * More bindings & examples to other data-science libraries (smile, d4j, spark, xgboost) * Evolve API to become more streamlined and _kotlineseque_ ### `kravis` * Increase API coverage * Stability in kshell --- # Next steps: Evolve Tooling ### > Promising tooling experiment & Great learning experience jupyter * [#12](https://github.com/ligee/kotlin-jupyter/issues/12) Support for custom type handlers * [#20](https://github.com/ligee/kotlin-jupyter/issues/20) Allow for multiple cell outputs * `DependsOnMaven` is not repeatable IDE tooling * [KT-11473](https://youtrack.jetbrains.com/issue/KT-11473) Allow debugging of Kotlin scripts Shell * Fix REPL issues * Rethink REPL concept in ide (kshell integration, better scripting) Ongoing [KEEP75 - Kotlin Scripting Support](https://github.com/Kotlin/KEEP/issues/75) to harmonize Dependency Management between different tools ??? ### Raise your voice and vote on https://youtrack.jetbrains.com `kts` support not yet ready for prime time graphics device: extension points + plugin * Embedded REPL output? dedicated tool window? Make the world a better place by raising... kotlin conf rumours about **Data-Science IDE** --- class: inverse # Summary ### _Yes we can_ build predictive models using Kotlin. There's a fascinating JVM data science ecosystem out there, ready to be unleashed on your data ### `krangl` is a {K}otlin library for data w{rangl}ing. It allows to filter, transform, aggregate and reshape tabular data ### `kravis` implements a convenient DSL to create a wide range of plots ### Tooling and Libraries are still evolving! ##### **Thanks to Kotlin and IDE team @JetBrains, github community, R/tidyverse community, <br>Scientific Computing Facility @ Max Planck Institute of Molecular Cell Biology and Genetics** Slides Repo: https://github.com/holgerbrandl/data_science_with_kotlin ??? evolving: Kotlin is young `krangl` tries to bring pandas/dplyr to Kotlin